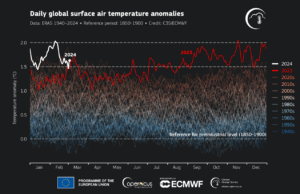
The graph shows the temperature record from the European Centre for Medium-Range Weather Forecasts (ECMWF). A temperature anomaly is the difference between the observed temperature and the average of 1850-1900. Each decade is color-coded and has ten lines, one for each year. The data for 2023 through February 2024 shows the sudden increase in temperature. Source: WMO
The graph shows the temperature record from the European Centre for Medium-Range Weather Forecasts (ECMWF). A temperature anomaly is the difference between the observed temperature and the average of 1850-1900. Each decade is color-coded and has ten lines, one for each year. The data for 2023 through February 2024 shows the sudden increase in temperature. Source: WMO
arnold2024-05-23T23:20:57+00:00